You are running pipeline reviews every week. You have a CRM full of data.
· Can you explain why revenue is behind target in under 60 seconds?
· Can you identify the exact sales stage causing revenue leakage?
· Can every sales manager answer the same question without opening the CRM?
If you answered “No” even once…
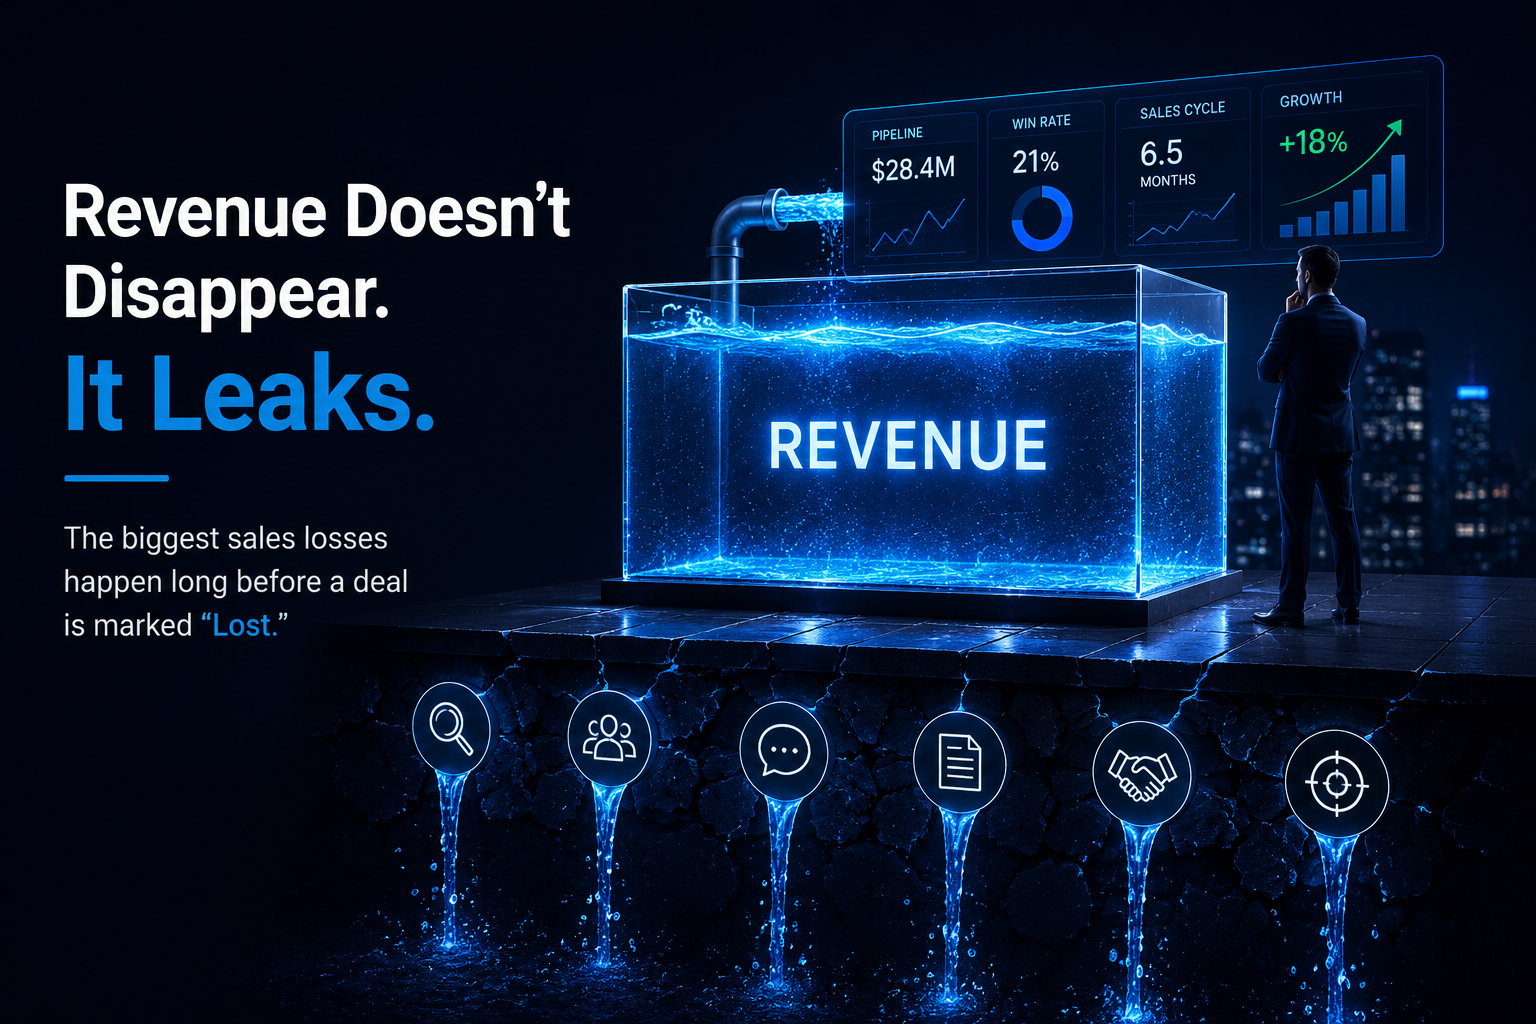
The problem is serious. Somewhere in your sales process, revenue is leaking. By the end of this article, you’ll know where to look.
And yet when someone asks which three things are actually driving your revenue gap this quarter, the answer is a longer silence than it should be.
That is not a tool problem. It is a metrics problem. Specifically, it is the problem of tracking the wrong sales KPIs, or tracking the right ones without the framework to turn them into decisions.
And if your board review is coming up, that silence carries weight. It signals the revenue gap has already formed. You are just the last to know, because the right numbers were not in front of you early enough.
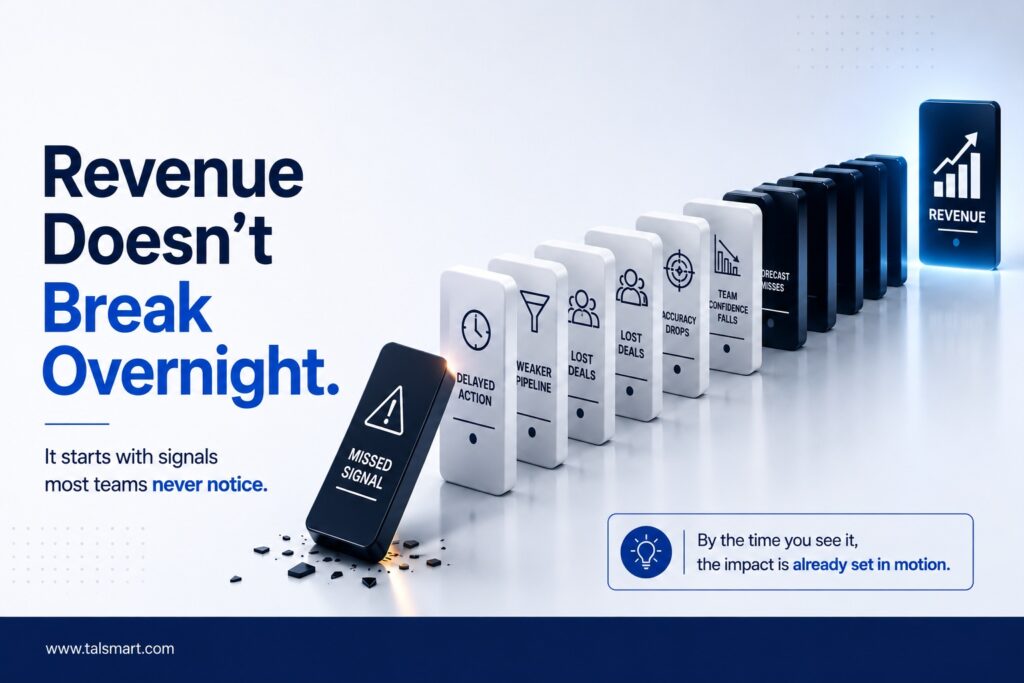
B2B tech sales in 2026 operates under conditions that make gut-feel pipeline management expensive. Buying committees are larger. Sales cycles are longer. Revenue forecasting mistakes that cost a quarter’s worth of growth are made in week two, not week twelve, and they are made because the right signals were not being watched early enough.
The B2B sales KPIs that predict outcomes in enterprise tech are not the same as the SaaS sales metrics designed for high-volume, short-cycle transactional deals. They are stage-specific, stakeholder-aware, and built to surface problems in multi-threaded deals before a quarter is already committed.
The sales leaders closing the gap between what they expect and what they close are not working harder. They are watching different numbers, earlier, and acting on them before the quarter is already committed.
Where Sales KPIs Sit in a Revenue Execution System
TALSMART’s Revenue Execution System runs on four layers. Diagnose, Build, Execute, Lead. Sales KPIs are the instrumentation that makes the Diagnose layer functional. Without the right metrics, you cannot identify where performance is breaking down, which means every decision about sales training programs, coaching investment, and pipeline intervention is made on assumption rather than evidence.
This is the root cause behind most B2B revenue gaps. Not underperforming reps. Not a weak product. An assumption-driven revenue engine where leaders react to closed-lost deals instead of reading the leading indicators that predicted the loss three stages earlier.
2.1x higher quota attainment is the measured difference between teams coached on data versus teams coached on gut feel. The difference is not effort. It is the quality of the signal the coaching is built on. (TALSMART Revenue-Gap Diagnostic, 4,200+ leaders benchmarked)
The Core Problem: Lagging Indicators Dressed Up as Strategy
Most B2B tech sales teams track revenue against target, quota attainment from last quarter, and win rate from the last 90 days. These are all lagging indicators. They tell you what happened. They do not tell you what is about to happen, and by the time they signal a problem, the deals that caused it have already closed or died.
A functional B2B sales KPI framework balances lagging indicators with leading ones. The lagging metrics confirm the result. The leading metrics give you time to intervene.
| Lagging Indicator (tells you what happened) | Leading Indicator (tells you what will happen) |
|---|---|
| Closed revenue this quarter | Pipeline velocity by stage right now |
| Quota attainment last quarter | Coaching coverage ratio this month |
| Win rate last 90 days | Buyer engagement rate on active proposals |
| Average deal size last period | Deal velocity trend by rep cohort |
| Revenue vs target | Forecast accuracy week over week |
Lagging indicators confirm the score. Leading indicators give you time to change it.
If your weekly pipeline review is entirely built on lagging indicators, your system is reacting to history, not managing the future.
The Seven Sales KPIs That High-Performing B2B Tech Teams Track Differently
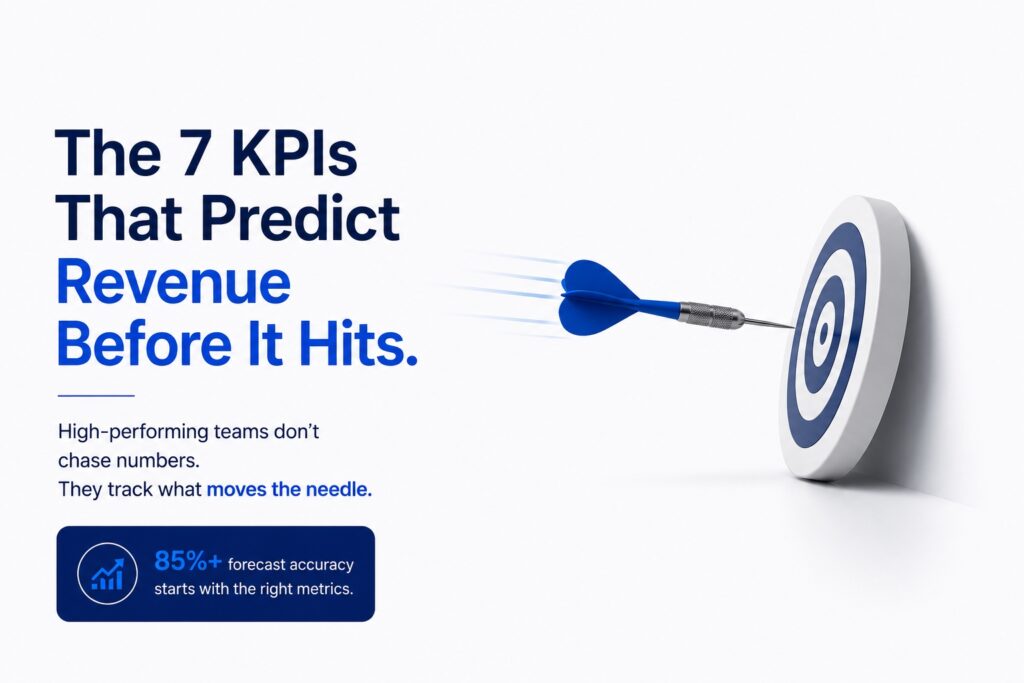
These are not the only metrics worth watching. They are the ones that separate teams with forecast accuracy above 85 percent from those below 70 percent, and the ones most consistently absent or misread in underperforming B2B tech sales organizations.
1. Pipeline Velocity
Pipeline velocity measures how quickly deals move through each stage of the B2B sales process, in revenue terms. The formula is straightforward: number of opportunities multiplied by average deal value multiplied by win rate, divided by average sales cycle length. The result tells you how much revenue your pipeline is generating per day.
Of all the sales pipeline metrics available to a B2B tech leader, pipeline velocity is the one most directly connected to revenue forecasting accuracy. It shows not just what is in the pipeline, but how much of it is moving, and how fast.
Do you know which stage of your pipeline has the highest average time spent?
What most teams miss is that pipeline velocity is stage-specific. A deal stalling between discovery and proposal is a different problem than a deal stalling between proposal and close. The first is a skill gap. The second is often a stakeholder alignment gap. Tracking velocity at the aggregate level hides both.
If your pipeline velocity report is a single number rather than a stage-by-stage breakdown, your system cannot tell you where deals are actually dying.
2. Forecast Accuracy
Forecast accuracy is the ratio of predicted revenue to actual closed revenue, measured week over week and quarter over quarter. Most revenue leaders know their forecast is off before the number is final. They just do not have the infrastructure to catch it early enough. High-performing B2B tech teams maintain forecast accuracy above 85 percent. The average sits below 70 percent.
Forecast accuracy directly measures leadership reliability. Above 90% builds stakeholder trust. Below 85% erodes it.
Revenue forecasting at this level is not a mathematical exercise. It requires sales analytics infrastructure that shows deal health signals in real time, not just rep-reported stage and close date. When reps self-report the deal stage without an evidence-based qualification layer underneath, forecast accuracy degrades to optimism management rather than revenue intelligence.
A rep moving a deal to ‘commit’ because they feel good about the relationship is not a forecast. It is a wish. The teams that hit their number have infrastructure that catches the difference.
3. Quota Attainment by Cohort
Quota attainment is the percentage of reps hitting their number in a given period. It is one of the most visible numbers in any sales organization, and also one of the most misread. The average across B2B tech teams sits at 42 percent. The top 4 percent of performers, as benchmarked across the TALSMART Revenue-Gap Diagnostic, attain between 82 and 145 percent.
The more important metric is quota attainment by cohort, separating new reps from reps with more than twelve months of tenure. If tenured reps are underperforming at the same rate as new reps, the problem is structural, not onboarding. If new reps are underperforming significantly more than tenured ones, the problem is in your sales onboarding and early coaching infrastructure, not in the B2B sales process itself.
If your quota attainment report is a single team-wide number, your system cannot distinguish a hiring problem from a coaching problem from a process problem.
Not sure which KPIs your team is actually moving? The Revenue-Gap Diagnostic benchmarks your reps across five B2B tech sales stages and surfaces the leading indicators driving your revenue gap. Free. 20 minutes. PDF report within 3 hours.
4. Sales Efficiency
Sales efficiency measures how much revenue is generated for every dollar invested in the sales function. This is where leaders often feel the pressure most acutely: headcount is growing, spend is rising, and revenue is not keeping pace. For B2B tech companies with complex enterprise deals, the benchmark is a ratio above 1.0, meaning every dollar spent produces more than a dollar in new revenue. Most teams tracking this metric see it decline as they add headcount without adding structure.
Sales efficiency is where revenue operations alignment becomes visible. When sales, marketing, and customer success are working from the same pipeline data and the same definition of a qualified opportunity, sales efficiency improves without headcount growth. When they are siloed, the cost of acquisition rises invisibly because the waste is spread across functions.
One of the fastest ways to boost efficiency is to get ruthless about who enters your funnel. Refine lead quality criteria using TALSMART’s Lead Quality Analysis Tool so reps spend less time chasing unqualified leads and more time with accounts that will close.
5. Customer Acquisition Cost
Customer acquisition cost is the total cost of closing one new customer, inclusive of sales salaries, marketing spend, tooling, and management overhead. In B2B tech sales, customer acquisition cost is a sales performance metric as much as a financial one. When it rises, it almost always traces back to one of three causes: deals taking longer to close, reps working unqualified opportunities too far into the pipeline, or a lack of structure in the qualification stage.
The BANT-PR qualification framework is specifically designed to address the second and third causes. It adds buyer process and risk analysis on top of the standard qualification criteria, removing deals from the pipeline early that would otherwise consume a rep’s time for six to eight weeks before dying at procurement. The reduction in wasted sales cycles is a direct reduction in customer acquisition cost.
6. Deal Velocity
Deal velocity is the average number of days from opportunity creation to close. It is distinct from pipeline velocity in that it measures the clock, not the revenue per day. In B2B tech, deal velocity has been extending as buying committees grow. The average enterprise deal now involves six to ten stakeholders, and each additional decision maker adds friction to the sales cycle.
Deal velocity in Software or digitalsales measures the speed and efficiency of your revenue engine.
Teams that compress deal velocity do it the same way every time. They qualify harder at entry, so fewer unqualified deals enter the pipeline and consume time. They align stakeholders earlier, using a structured approach to multi-threaded selling rather than assuming the champion will carry the internal case. And they use sales coaching embedded in active deals, not in post-deal review, so reps get guidance while there is still time to act on it.
Globant reduced deal velocity by 34 percent in six months using exactly this approach. The reduction came not from closing faster but from stopping slow deals earlier and advancing real ones more deliberately.
7. Revenue Intelligence Coverage
Revenue intelligence coverage is the percentage of deals in your pipeline that have an objectively verified next step, a mapped buying committee, and a documented pain statement from the primary decision maker. Most teams underestimate how many of their active deals fail this test. It sounds administrative. It is actually the most predictive KPI in enterprise B2B sales.
Teams with high revenue intelligence coverage can forecast accurately because their deals are real. Teams with low coverage have pipelines full of hope-stage opportunities where reps are optimistic but evidence is thin. The difference shows up in forecast accuracy, quota attainment, and ultimately in sales efficiency, which is why revenue intelligence is not a CRM hygiene metric. It is a revenue performance metric.
If your pipeline review cannot answer who the economic buyer is, what pain they have committed to solving, and when they need to decide, your revenue intelligence coverage is too low to forecast from.
How These KPIs Compare: Average B2B Tech Team vs Top 4%
| KPI | What It Measures | Average B2B Tech Team | Top 4% Benchmark |
|---|---|---|---|
| Pipeline Velocity | Speed deals move through each stage | Stalls at Discovery or Proposal | 34% faster cycle than baseline |
| Forecast Accuracy | Predicted vs actual revenue | Below 70% | Above 85% |
| Quota Attainment | % of reps hitting target | 42% | 72 to 78% |
| Sales Efficiency | Revenue generated per dollar of sales cost | Low, worsening with headcount | Improves quarter over quarter |
| Customer Acquisition Cost | Total cost to close one new customer | Rising year over year | Stabilised by structured process |
| Deal Velocity | Average days from open to close | Extending with buyer committee size | Compressed by structured qualification |
Source: TALSMART Revenue-Gap Diagnostic benchmarks across 4,200+ leaders in 109 countries.
Tracking These KPIs Is Not Enough Without the Infrastructure to Act on Them
Most B2B tech sales leaders know these metrics exist. The gap is not awareness. It is the infrastructure that turns a number on a dashboard into a decision in a pipeline review, and a decision in a pipeline review into a coaching conversation that changes what a rep does on the next call.
That infrastructure is what separates a revenue operations function from a reporting function. Revenue operations aligned to the B2B tech sales strategy connects KPI movement to coaching decisions, sales training programs to diagnose skill gaps, and deal-level data to rep-level development. Without that alignment, sales analytics produces reports that get reviewed and forgotten.
If your sales analytics platform is producing data that nobody is coaching from, the problem is not your tools. It is the absence of a system that connects the data to the decisions it should be driving.
Sales coaching built on KPI data rather than impression is what the evidence consistently points to. The 2.1x quota attainment advantage of coached teams over uncoached ones is not a coaching quality advantage. It is a signal quality advantage. The coaching is only as good as the data it is built on. (TALSMART Revenue-Gap Diagnostic)
If your sales analytics platform is producing data that nobody is coaching from, the problem is not your tools. It is the absence of a system that connects the data to the decisions it should be driving.
Find Out Which KPIs Are Hiding Your Revenue Gap
The Revenue-Gap Diagnostic benchmarks your team across five B2B tech sales stages and shows exactly which leading indicators are moving in the wrong direction before the quarter closes. Free. 20 minutes. PDF report within 3 hours. No sales call required.
Frequently Asked Questions
What are the most important sales KPIs for B2B tech companies in 2026?
The highest-value sales KPIs for B2B tech leaders are pipeline velocity by stage, forecast accuracy, quota attainment by cohort, sales efficiency, customer acquisition cost, deal velocity, and revenue intelligence coverage. The distinction that matters is tracking leading indicators alongside lagging ones. Lagging metrics confirm what happened. Leading metrics give you time to intervene before the quarter is already committed.
What is pipeline velocity and why does it matter for sales performance metrics?
Pipeline velocity measures how much revenue your pipeline is generating per day, calculated from the number of opportunities, average deal value, win rate, and average sales cycle length. Tracking it stage by stage rather than as a single number shows exactly where deals are stalling. A stall at discovery is a skill gap. A stall at proposal is usually a stakeholder alignment gap. Both require a different intervention.
How do you improve forecast accuracy in B2B tech sales?
Forecast accuracy improves when deal stage advancement is based on evidence rather than rep optimism. This requires a qualification framework that maps buyer intent, stakeholder alignment, and documented pain at each stage of the B2B sales process. Revenue intelligence coverage, the percentage of deals with a verified next step and mapped buying committee, is the single strongest predictor of forecast accuracy for enterprise tech teams.
What is the difference between sales KPIs and revenue operations KPIs?
Sales KPIs typically measure individual and team performance at the deal level: quota attainment, deal velocity, win rate. Revenue operations KPIs measure the efficiency and alignment of the full revenue system: sales efficiency ratio, customer acquisition cost, pipeline health across marketing, sales, and customer success. High-performing B2B tech organizations track both and connect them to a shared set of pipeline data rather than managing them in silos.
How does sales coaching connect to KPI improvement?
Sales coaching is the mechanism that translates KPI insight into rep behavior change. Data showing pipeline stagnation at a specific stage points to a skill or structural gap. Coaching that addresses that specific gap in the context of a live deal is what closes it. TALSMART’s Revenue-Gap Diagnostic data shows 2.1x higher quota attainment for teams coached on data versus teams coached on gut feel, and 3x higher ROI from coaching versus training alone when coaching is embedded in active pipeline reviews.
What is a good quota attainment rate for B2B tech sales teams?
The industry average for B2B tech is 42 percent of reps hitting quota in any given period. High-performing teams benchmarked through the TALSMART Revenue-Gap Diagnostic achieve between 72 and 78 percent. The more useful question is not what percentage are hitting quota, but whether the gap between high performers and the rest is closing. A compressing gap indicates a structural system is working. A persistent or widening gap indicates the team is still dependent on hero reps.
TALSMART is a global revenue execution partner for B2B technology companies, operating across 109 countries and 23 languages. The Revenue Execution System is built exclusively for the complexity of enterprise technology sales.